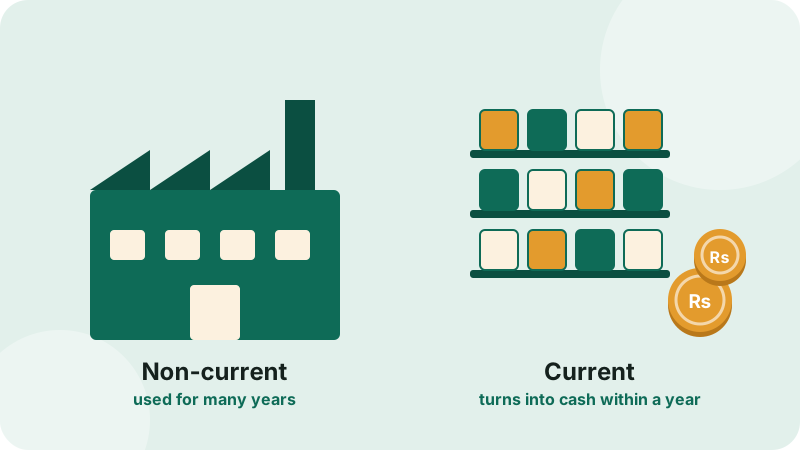
The left side of every balance sheet lists what a company owns: its assets. Just like liabilities, assets are divided into two groups based on time: things used for many years, and things expected to turn into cash soon.
Explained with a shop
Imagine a general store in your neighbourhood:
- The shop building, shelves, freezer and delivery motorbike are used for years. These are non-current assets.
- The goods on the shelves, money customers owe on credit (the "khata"), and cash in the drawer will turn into cash within weeks or months. These are current assets.
The 12-month rule
Non-current asset = held and used for more than 12 months
Non-current assets
- Property, plant and equipment (PPE): land, buildings, factories, machinery, vehicles. Usually the biggest asset of a manufacturing company. Except for land, these lose value each year through depreciation.
- Right-of-use assets: the "other side" of a lease. If a company rents a showroom for 5 years, it records the right to use that showroom as an asset (and the rent it owes as a lease liability).
- Intangible assets: things you can't touch, such as software, licences and brands.
- Long-term investments: shares in other companies, often subsidiaries or associates, held for the long run.
- Long-term loans, advances and deposits: for example security deposits paid for utilities or leases.
Current assets
- Stores, spares and loose tools: parts kept for maintaining machines.
- Stock-in-trade (inventory): raw materials, work in progress and finished goods waiting to be sold.
- Trade debts (receivables): money customers owe for goods sold on credit.
- Loans, advances, deposits and prepayments: short-term amounts paid in advance, like advance rent or insurance.
- Short-term investments: treasury bills, mutual fund units or deposits held for less than a year.
- Cash and bank balances.
Worked example
Ravi Textiles Ltd (fictional), Rs million:
| Non-current assets | Rs m |
|---|---|
| Property, plant and equipment | 1,100 |
| Right-of-use assets | 70 |
| Intangible assets | 10 |
| Long-term investments | 100 |
| Long-term deposits | 20 |
| Total non-current | 1,300 |
| Current assets | Rs m |
|---|---|
| Stores, spares and loose tools | 60 |
| Stock-in-trade | 380 |
| Trade debts | 300 |
| Advances and prepayments | 40 |
| Short-term investments | 50 |
| Cash and bank balances | 70 |
| Total current | 900 |
Total assets = 1,300 + 900 = Rs 2,200 million.
Working capital and the current ratio
Ravi Textiles has current liabilities of Rs 700 million (see our liabilities guide).
Positive working capital means the company can cover its short-term bills from its short-term assets. But not all current assets turn into cash quickly: stock may take months to sell. A stricter test removes stock and stores:
A quick ratio below 1 means the company relies on selling its stock to pay its bills on time, which is common for manufacturers but worth watching.
What to look out for
- Trade debts growing faster than sales: customers are paying more slowly.
- Stock piling up: goods may not be selling.
- Heavy investment in PPE: often a sign of expansion; check whether it is funded by loans.
- Total assets must equal total liabilities plus equity: here 2,200 = 1,300 liabilities + 900 equity.