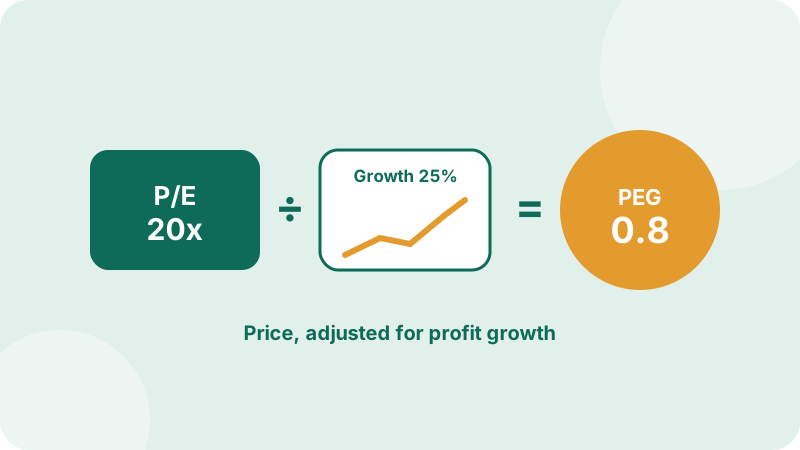
The P/E ratio tells you how much you pay for each rupee of profit. But it misses something important: is that profit growing? A company whose profits double every few years deserves a higher price than one whose profits barely move. The PEG ratio brings growth into the picture.
An everyday example
Two shops are for sale, each earning Rs 1 million a year.
- Shop A costs Rs 20 million, but its profit is growing 25% a year because a new housing society is filling up nearby.
- Shop B costs Rs 10 million, but its profit grows only 5% a year.
Shop B looks cheaper. But in a few years, Shop A could be earning far more. Which is the better deal? PEG helps answer exactly this.
PEG ratio formula
Use the growth rate as a plain number: for 25% growth, divide by 25, not by 0.25.
Worked example
| Company (fictional) | Share price | EPS | P/E | EPS growth | PEG |
|---|---|---|---|---|---|
| Sitara Tech | Rs 200 | Rs 10 | 20x | 25% | 0.8 |
| Ravi Textiles | Rs 100 | Rs 10 | 10x | 5% | 2.0 |
Sitara Tech: EPS grew from Rs 8 to Rs 10, which is 25% growth. P/E = 200 ÷ 10 = 20. PEG = 20 ÷ 25 = 0.8.
Ravi Textiles: P/E = 100 ÷ 10 = 10, growth 5%. PEG = 10 ÷ 5 = 2.0.
On P/E alone, Ravi Textiles looks twice as cheap. But after adjusting for growth, Sitara Tech is cheaper: you pay less for each unit of growth.
How to read PEG
- PEG below 1: the share may be cheap compared with its growth.
- PEG around 1: price and growth are roughly in balance.
- PEG above 1: you are paying more for each unit of growth. It may be expensive, or investors may expect even faster growth later.
These are rules of thumb, not fixed laws. Compare PEG between companies in the same sector.
Where does the growth number come from?
- Past growth (trailing): for example, average EPS growth over the last 3–5 years. It's based on facts, but the past may not repeat.
- Expected growth (forward): analysts' forecasts for the next few years. More relevant, but forecasts can be wrong.
Avoid using one unusual year. If EPS jumped 80% because of a one-off gain, PEG will look misleadingly low.
Limitations of PEG
- Doesn't work with falling or negative EPS: negative growth or losses make PEG meaningless.
- Ignores dividends: a slow-growing company paying a high dividend can look expensive on PEG while still giving good returns.
- Ignores debt and risk: fast growth funded by heavy borrowing is riskier. Check the liabilities too.
- Growth rarely lasts forever: very high growth rates usually slow down.